RO Membrane Health & Normalized Data
The purpose of RO data collection and analysis is to understand the true condition (health) of the RO membranes and to help troubleshoot any potential problems before they become serious.

Normalized Data Factors
Normalized data factors in external factors that can affect membrane performance so you can compare apples to apples when reviewing normalized data. RO data that is normalized is then compared to a baseline (when the membranes were new, replaced or cleaned).
All of these operating conditions directly affect the quality and amount of permeate water that the RO membranes can produce. However, since these operating conditions are constantly changing, it is impossible to compare the observed performance of certain parameters at one point and compare them to another point under different operating conditions. Changing factors such as temperature, feed water quality, permeate flow and system recovery all has an effect on membrane performance.
Data that is not normalized can be misleading, as there are many variables that can cause changes that may appear to be problems when in fact they are not. Temperature of the feed water is the most noticeable condition affecting the performance of RO systems. The general rule of thumb is to estimate a permeate flow change of 1.5% per degree Fahrenheit (F˚). For example, if an RO produced 50 GPM of permeate when the feed water was 60 F˚ and later the feed water temperature dropped 5 F˚, then the RO would produce approximately 46 GPM. This 4 GPM drop in product is perfectly normal given the temperature drop.
Membrane Health
The following raw data is collected to determine the health of the RO membrane.
Feed Temp (°F)
Permeate Flow (GPM)
Concentrate Flow (GPM)
Feed Pressure (PSI)
Feed Conductivity
Permeate Conductivity
Concentrate Pressure (PSI)
Permeate Pressure (PSI)
Normalizing RO data allows the user to compare the performance of an RO membrane performance to a set standard which does not depend on changing operating conditions. Normalized data will measure the direct condition of the RO membrane and show the true performance and health of an RO membrane.
Data Interpretation
An RO operator is ultimately concerned about two outcomes: the quality and quantity of water being produced. As mentioned above, these two factors can be influenced by a number of variables such as feed water pressure, system recovery, and changes in feed water quality to name a few.
There are three calculated values which help give a better picture of true membrane performance and help accurately troubleshoot potential RO system problems involving the quantity and quality of water being produced by the RO system. By collecting operating data, normalizing the data and then trending the normalized data over time and comparing the values to a baseline (a baseline is considered the start-up values when the RO membranes are new or after they have been cleaned or replaced) you can proactively address any problems before irreversible damage to the RO membranes occur. The three calculated values to monitor and trend are Normalized Permeate Flow (NPF), Normalized Salt Rejection (NSR) and Normalized Pressure Differential (NPD)
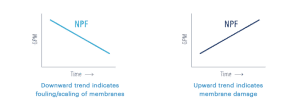
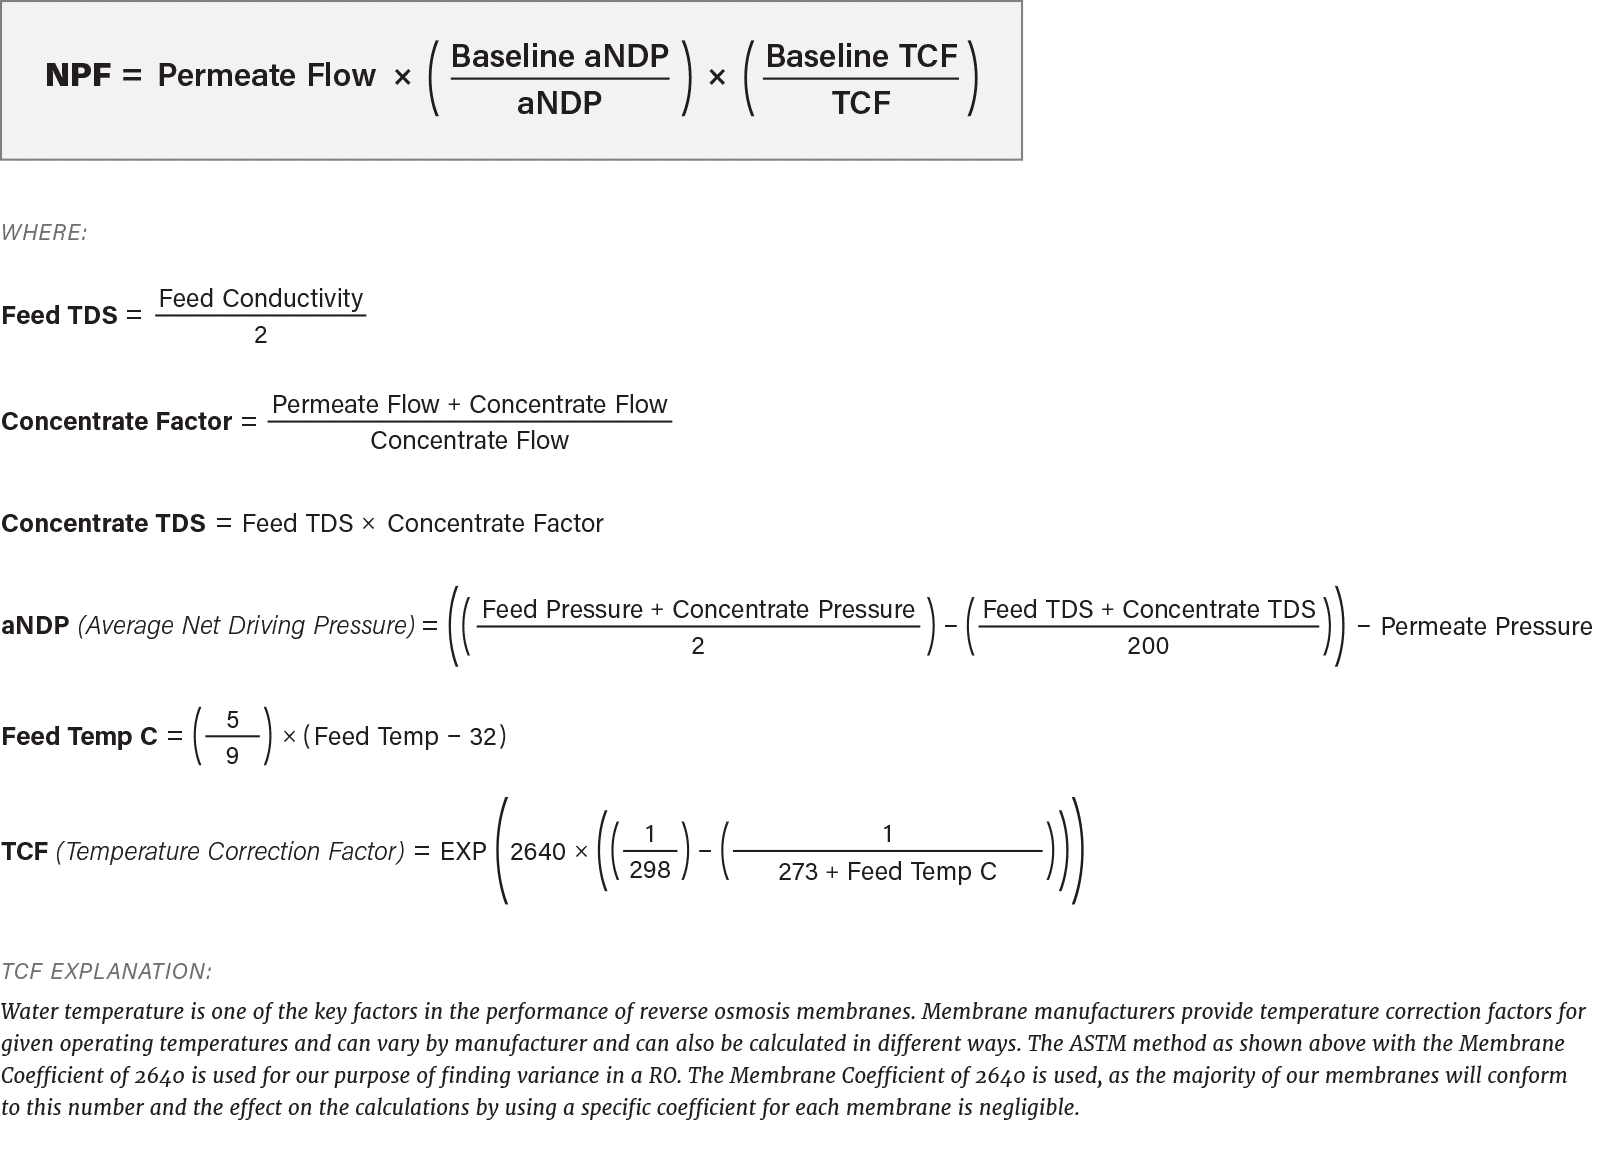
Normalized Permeate Flow (NPF)
If the NPF increases then this implies that there is damage to the RO membrane. This damage can be caused by chemical attack (from an oxidizer like chlorine) or a mechanical issue (like an O-ring failure) on the membrane.


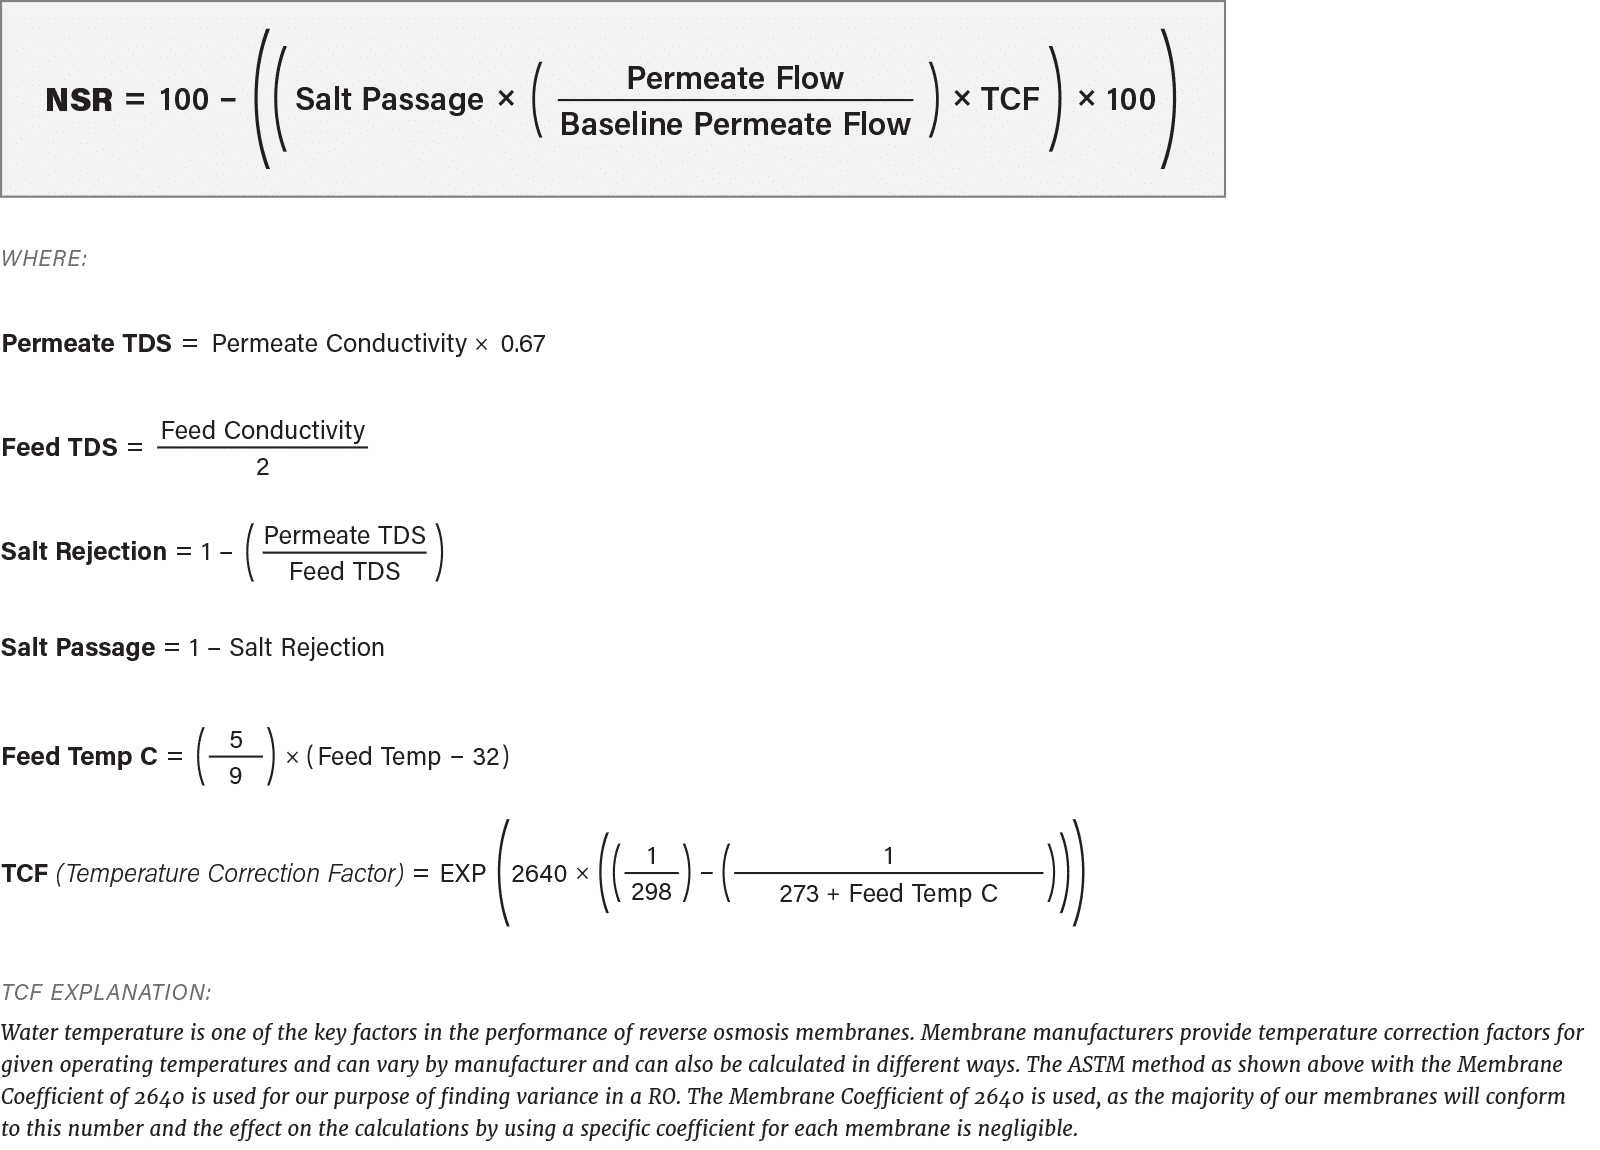
Normalized Salt Rejection (NSR)
A well performing RO membrane should be providing 97% to 99% rejection and a membrane is considered ‘bad’ when the RO rejection drops to 90% or less. Over normal operation of an RO membrane you can expect to see the NSR steadily decline during continuous use. RO membranes usually last for several years before they require replacement and a steady decline in NSR is a normal sign of an aging membrane. A proper cleaning regiment for RO membranes can help improve the NSR.
NSR can be helpful in identifying biofouling issues. When biofouling is a concern, oftentimes the NSR will actually increase and the NPF will decrease. This is because the biofoulant will actually seal small imperfections in the RO membrane thereby increasing the rejection of salts. Over time, the biofoulant layer ages and begins to die, many items such as CO2, methane, organic acids begin to diffuse through the membrane, ultimately affecting the quality of the permeate water (less salt rejection resulting in a lower NSR).
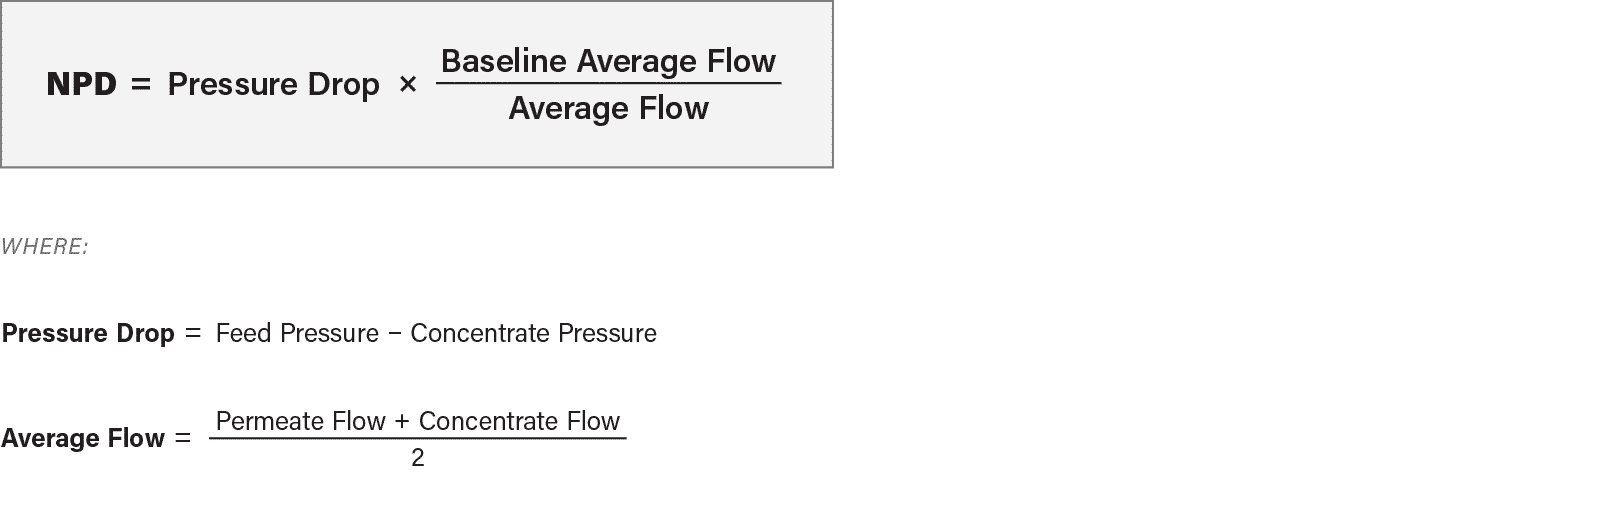
Normalized Pressure Differential (NPD)
The NDP will begin to increase over time due to fouling or scaling and RO membranes should be cleaned when the NDP increases by 15% to 25% above the baseline value. NDP and NPF should be monitored together to determine when the RO membranes should be cleaned. Often the NPF will decrease and the NDP will remain unchanged. This is simply because the fouling/scaling issues have yet to plug the feed water spacers. In time the NDP will increase in conjunction with the drop in NPF.
A decrease in NPD is usually due to faulty instrumentation or mistakes made during data collection.
If NPD can be measured for each stage of an RO, usually problems can be identified between fouling and scaling based on the location of the increased pressure drop. An increase in NPD in the front stage of an RO indicates fouling issues and an increase in NPD in the second stage indicates scaling.